Clients and Friends, Greetings to those reading my opinions for the first time. My name is Kenrick Moore, I’m President and one of the founding partners of Quantum Financial Partners, and starting January first, will serve as chair of our Investment Committee. I’ve been an interested market observer as long as I can remember, and have been actively managing client accounts for the last 18 years. I’m also portfolio manager for the hedge fund “Octopus” which began as a long/short fund in 2009, and switched styles to a “market neutral” fund-of-funds midway through 2016.
With the intro out of the way, I’d like to share my thoughts on the current state of the financial markets.
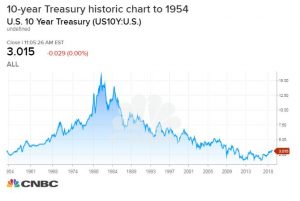
2018 has been difficult to navigate, and 2019 may be as well due to several long term market influences that have changed character . Chief among them is interest rates. Trends in interest rates traditionally persist for long periods of time. Until late 2017, interest rates in the U.S had been on a downward trend since the hyper-inflation years in the early eighties. Not so long ago, after waves of credit easing that allowed an early recovery from “the great recession”, there was even talk of negative interest rates, whereby, you would pay the bank for the privilege of holding your cash. That tide seems to have turned, interest rates have risen, so stocks (SPY, down 2.4% ytd) and bonds (LQD, down 7% ytd), previously the only games in town, now face competition from risk-free money markets and CDs.
Because higher interest rates are typically the result of a strengthening economy, it’s possible for stocks to co-exist with higher rates. It’s a different story for bonds. While the bond coupon is not affected and will be paid, the capital value of bonds mathematically decline with rising rates.
 Gold, (GLD, down 5% ytd) which has traditionally been a place to turn in times of market stress, and paradoxically served as both a hedge against inflation, and a hedge against deflation, has not performed well due to the dollar’s strength. The dollar is robust due to the relative strength of the US economy compared to other world economies, whose collective weakening has fanned fears of a global recession and dropped global stock markets (EFA down 14%) into correction territory.
For a more in depth picture of this rare “no winners” phenomenon, check out this NY Times article below.
https://www.nytimes.com/2018/12/15/business/stock-market-decline-commodities-bonds.html
The spectra of rising interest rates is of course not the only concern. We hear much about a trade war, and whether justified or not, the constant headlines fuel uncertainty. Our political system is under seldom seen scrutiny. There is concern about the old age of our Bull Market. We’ve had an extraordinary run, up almost 300% from the lows of January 2009. There is concern that the big tech stocks that have led the way up have run out of steam.
So what does it all mean, and where do we go from here?
In times of market stress, sometimes the charts can provide a roadmap.
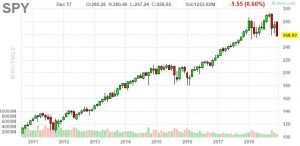
 This is a long term view of SPY, which is an ETF that mimics S&P 500. This chart put the gains of the bull market in perspective, and also illustrates that the dual corrections of this year can be viewed as one event.
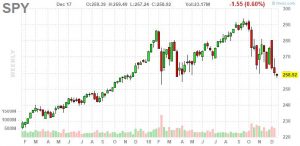
 Here is the weekly view. Striking to me is that the years dual corrections look remarkably similar in scope. February’s correction lasted 10 weeks and dropped 11.76% peak to trough. We’ve been in our current correction for 12 weeks, and have dropped 12.01% to date.

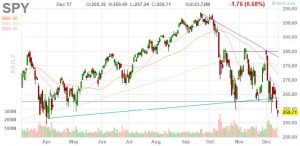
This is a daily chart and from my perspective looks a bit ominous. You can see the wide but well defined range the market has traded since mid-October. Fridays price on close was the first time we’ve closed under that range. That close, plus the feeble rebound attempt of the past week, leads me to believe the market has further issues to sort and the path of least resistance is down. That view will be reinforced if stocks can’t quickly jump back into the range. The longer they stay under the range, the more likely a new and lower range is established.
So how far will stocks drop? On Oct 30th I wrote the following:
In comparison with the correction with February of this year, this one, while certainly volatile, has seemed more orderly. That is not always a positive sign as I usually identify a correction culmination with a rally that’s too fast to easily buy. Trying to time the bottom is always extraordinarily difficult, and my few attempts at re-entry have so far been unprofitable. That lack of success plus the recent tendency to close near the bottom of the days range, leads me to believe the correction is not yet done.
In times of market stress, traders look toward technical levels as an indication of future price direction. Often, a stock or index will be drawn up or down to those levels like a magnet. Since we seem to be in a well-defined downtrend, the next level I’m looking at on the SPY (the ETF for the S&P 500) is 253. which was the lowest point of the Feb. correction. If achieved, that would represent a further drop of 5% and I would expect stocks to bounce, at least temporarily, from that level. If that level is breached without a fight, the long-term moving average could be in play, and if achieved would represent a further drop of 12% from current levels and represent, in my opinion, a terrific lower risk opportunity to re-deploy capital. As I write today, those levels still look valid. 253, or 2530 on the S&P is a short term target from which I think we bounce at least temporarily. That’s only about 2.5% away so another bad day will get us there. If that level folds, I believe the long term moving average of 238 is the target. That would represent a correction of 19% from the top, and another 7% from here. Not quite an official bear market but a meaningful correction. While economic numbers don’t yet suggest a recession, there is a school of thought that suggests that big stock corrections can lead to economic slowdowns due to a reverse wealth effect. If we do get a recession, a longer term bear market is pretty much baked in the cake.
So what are the chances of that happening? I’d put the chances of another 2.5% down at about 75%, and the chances of another 7% down at about 50%. I don’t want to call a bear yet. It is fair to note that after my Oct 30 letter, the market promptly rose 4% in five days, so something similar could absolutely happen again and the market leaps higher from here.
So what should we do? Remember that corrections and the occasional Bear Market are part of the stock market experience and are necessary to cleanse the system and prime for fresh gains. The market has gone on to new heights 100% of the time. Trying to time the market is usually futile, and if done, should be viewed as something that will allow you to sleep better, but will probably cost you money in the long run. Now is a good time to talk with your advisor, and make sure you are invested in a manner consistent with your tolerance for risk. If you can’t afford a loss from this level and you’re heavily invested in equities, then let’s take some off the table and diversify.
Best regards, Kenrick Moore